Reading the Activity Log
The main Activity Log screen (Activity Log → Activity Log) is where you explore everything that has happened on your WordPress site. It presents a filterable, paginated list of events with instant access to full event detail.
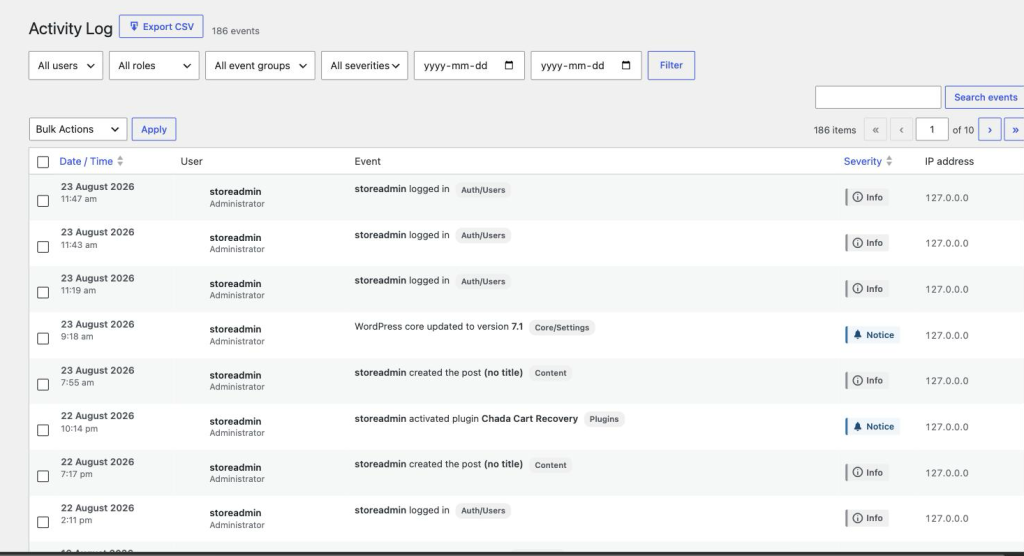
The filter bar
At the top of the screen a filter bar lets you narrow the event list along five dimensions:
| Filter | What it does |
|---|---|
| Category | Limit to one event group: auth, content, taxonomy, media, comments, plugins, themes, core, or menus. |
| User | Limit to events generated by a specific user (select from a searchable dropdown of registered users). |
| Severity | Limit to one severity level: info, notice, warning, or critical. |
| Date range | From and To date pickers that filter by the created_at timestamp. |
| Search | Full-text search across the message, object_name, and user_login columns. |
Click Apply to run the filter or Reset to clear all filters and show the full log. The current filter state is preserved in the URL so you can bookmark or share a specific view.
Column guide
| Column | Database field | What it shows |
|---|---|---|
| Date | created_at |
Timestamp of the event in WordPress’s configured timezone, shown as both absolute time and a human-readable “X minutes ago” tooltip. |
| User / Role | user_login / user_role |
Display name of the actor (links to their profile) plus their primary role at the time the event was recorded. |
| IP | ip |
IP address of the request. Shows as x.x.x.xxx when Anonymize IP is enabled. |
| Category | event_group |
The event group (auth, content, etc.) as a colour-coded badge. |
| Severity | severity |
Colour-coded severity badge: blue (info), green (notice), amber (warning), red (critical). |
| Object | object_type / object_name |
The thing acted on — for example Post: “Hello World” or Plugin: WooCommerce. |
| Description | message |
Human-readable summary of what happened, for example “Post status changed from draft to publish”. |
Opening the event detail panel
Click anywhere on an event row to open the slide-in Event Detail Panel. The panel loads the full event record — including the raw context JSON with old and new values for content changes — without leaving the page. See Event Detail and Context for a full walkthrough.
Dashboard widget
Chada Activity Monitor adds a Recent Activity widget to the WordPress Dashboard. It shows the latest five events site-wide with their severity badge, user, and description. Click any event to jump straight to the full log filtered to that event.
Severity levels in detail
| Level | When it is used |
|---|---|
| Info | Everyday, expected actions that require no intervention: successful logins, post views, comment approvals, successful password resets. |
| Notice | Significant but normal changes: a new post published, a plugin activated, a theme switched. Worth knowing about but not alarming. |
| Warning | Actions that could be impactful if done unexpectedly: a plugin deactivated, a WordPress option updated, a user’s role changed. Investigate if you did not authorise these yourself. |
| Critical | Security-relevant or high-impact events: repeated failed logins, a new administrator account created, a WordPress core update, or a user deleted. The Email on Critical setting can alert you by email for these immediately. |
Access control
By default only site administrators can view the Activity Log. You can extend access to additional roles via Settings → Access → View roles. Users with access are granted the virtual capability cam_view_log — you can also assign this capability directly to any role using a capabilities plugin if you need fine-grained control.